
TURN
FIRST TIME reservations
INTO
REGULARS


Food for thought

What others think about Zenchef


Frequently asked questions
Zenchef is a restaurant management software solution that simplifies the customer restaurant experience. Everything is centralised in a single management tool, which makes your day-to-day life as a restaurant owner easier. With the various services offered, the customer experience is streamlined, fluid and effortless. For restaurant owners, your teams save time, you increase customer loyalty, and you remain 100% independent.
Absolutely. ZenchefOS can be integrated with all types of restaurant software, including cash register software. Whatever cash register you use, you’ll have no problem connecting it up with our restaurant management software.
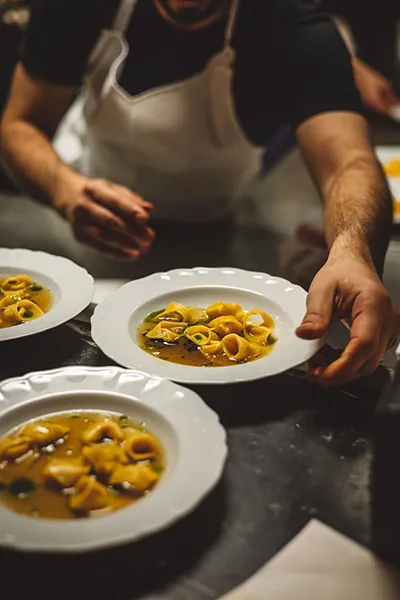
Zenchef offers a comprehensive restaurant management software solution, dedicated to the customer experience and restaurant owners. Zero commissions and zero intermediaries guarantee the profession’s independence. With a single management software solution, restaurant owners can manage their bookings, website, digital menus (online or via a QR code), digital pay-at-table payments and billing, order taking, Click & Collect, and stock management. Restaurant owners can also manage their online reviews, and customer files - that they, and only they, own.
Our restaurant management application is available in six languages (English, French, Dutch, German, Spanish and Portuguese) and in all countries.